Page 1 of 1
RT coverage
Posted: Tue Sep 03, 2024 8:05 am
by admin
RealTraffic combines global traffic coverage from several providers we have contracts with. The data sources are to a large degree ADS-B data aggregators themselves, but they also include some satellite derived positions via ADS-C and some (rare) live ADS-B satellite positions. I am operating a handful of ADS-B receiver stations myself to help augment and fill gaps where possible.
Most of the satellite derived positions are ADS-C derived, that means they only provide position updates every 10 minutes. I order to make the remote data more realistic, RT runs an interpolation job with that fills in the positions received every 10 minutes with intermediate positions, so that when you fly with a time offset of 10 minutes or more, you will see most of the remote oceanic and polar traffic around you on those long hauls.
You can see the daily coverage plots on the main website, the daily plot linked here:

The yellow points show traffic below 10'000ft, while the cyan points are above 10'000ft. Remember you can also check the coverage for airports using the
https://www.flyrealtraffic.com/coverage.html.
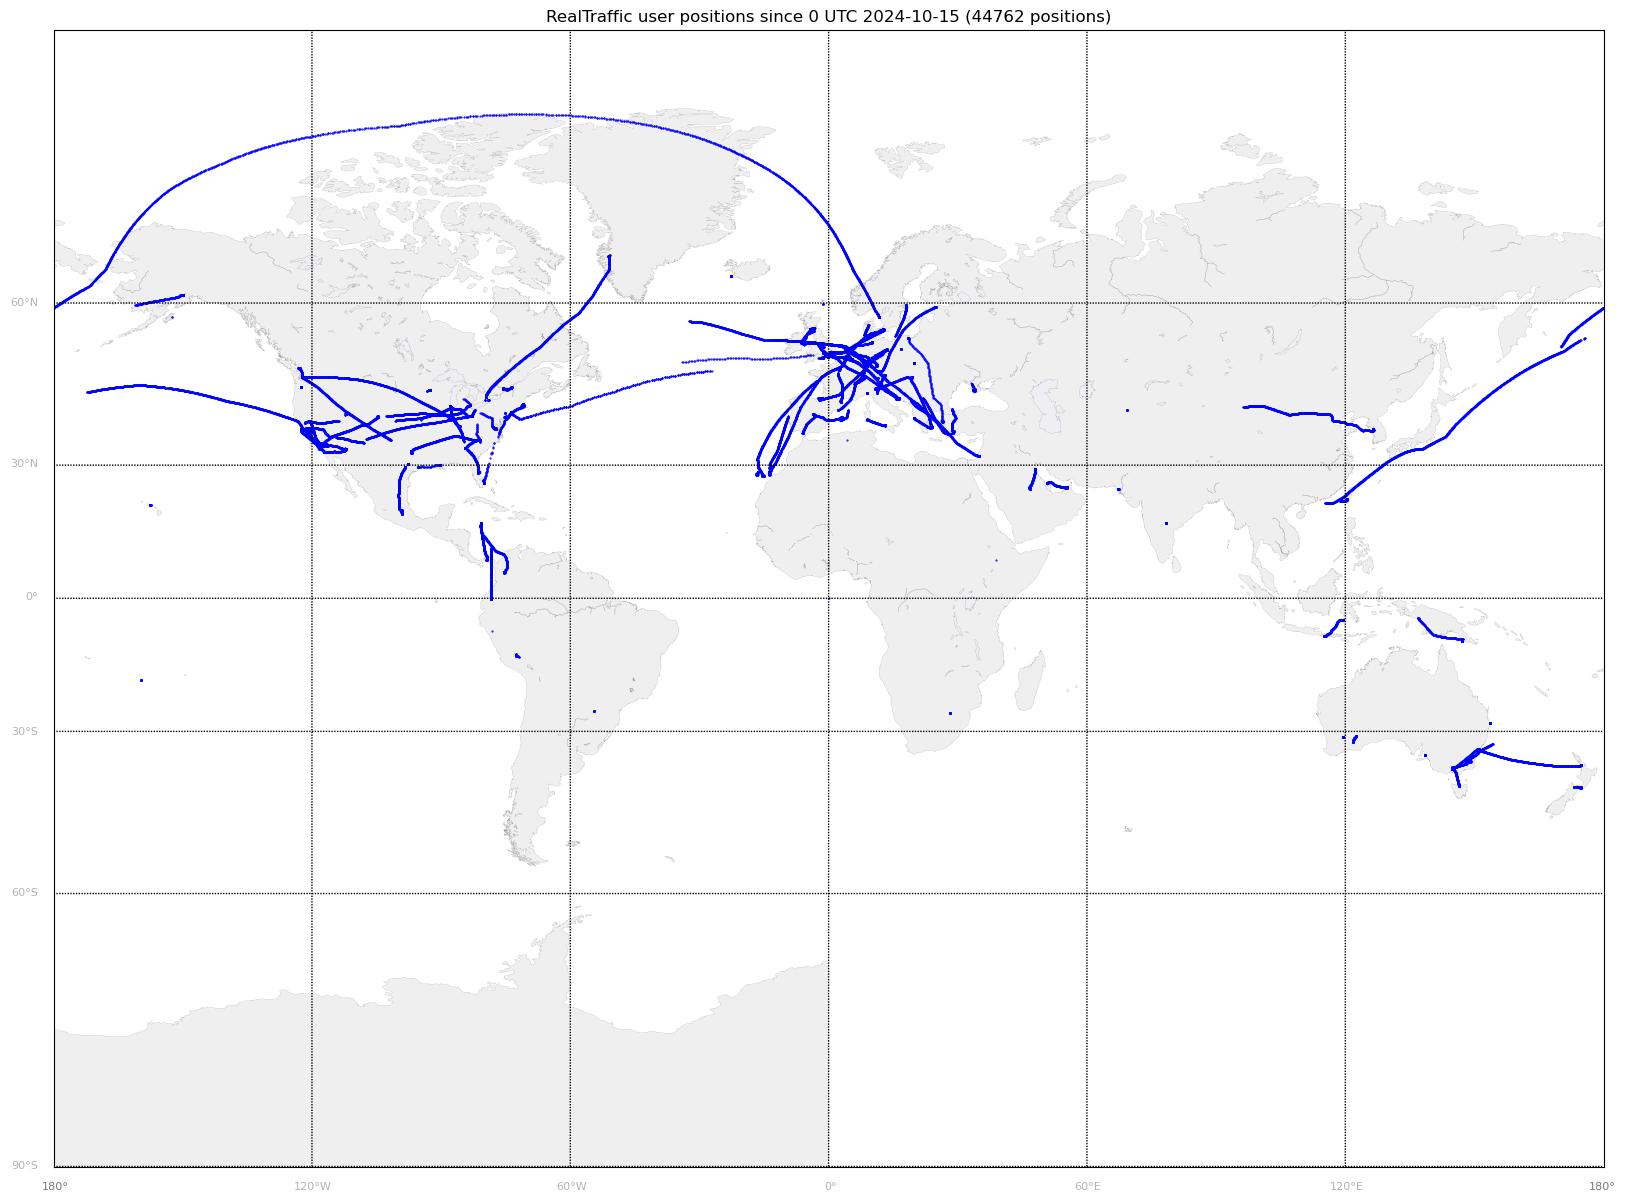
I'm also creating a daily coverage plot of where RT users are flying. See if you can spot your own tracks you make!
Re: RT coverage
Posted: Wed Sep 18, 2024 6:55 am
by Harrier77
Hi,
Regarding the RealTraffic airport coverage plots, I am finding the information displayed unhelpful for determining the RT coverage I should expect at the airport being looked at.
In the notes on the website flyrealtraffic.com/coverage you state "Note that for data feeds not providing signals strength, you'll see -49.5dB as the signal strength value. That doesn't mean there's poor coverage, just no signal strength available." My question is why do this? Unless I misunderstand the notes, an airport will show poor coverage even when it may be good because it shows "bad coverage" colours from the data providers that do not provide signal strength. Would it not be better to exclude data providers that do not provide signal strength from the graphical display at the airport? This would at least show the quality of the data from the providers who supply signal strength.
I hope all this makes sense.
Peter
Re: RT coverage
Posted: Wed Sep 18, 2024 8:21 am
by admin
Hi Peter,
It would be misleading to not display data from providers that don't indicate a signal strength. Take the example of OTHH, there's nearly perfect ground coverage from one of the providers that doesn't give signal strength, and relatively poor coverage from those who do. So you'll have good coverage on ground when using RT in your sim, but the plot wouldn't show that.
The signal strength is only plotted for the purpose of identifying which parts of an airport have poor coverage. So if you are able to place an ADS-B receiver in a location that is able to cover that gap and feed your traffic into pretty much any of the ADS-B tracking systems that provide you with instructions on how to feed, the coverage in RT will improve as well, as we have data sharing agreements with the majority of providers out there.
Re: RT coverage
Posted: Mon Sep 23, 2024 5:03 am
by Harrier77
Hi,
Thank you for the explanation.
The plots are therefore pointless for users who just want to know what the full RT coverage is like at a particular airport for their flight sim sessions.
Is there any way you can show what the overall RT coverage is like at an airport so that a user of PSXT for example can decide whether to go to an airport or not? Maybe just a simple very good, good, medium, poor, very poor classification? This is important information that is required before planning a flight or a spotting session.
Peter
Re: RT coverage
Posted: Mon Sep 23, 2024 7:01 am
by admin
Can you define "overall RT coverage"? In my view (and explanations above) that's exactly what's being shown in the plots!
Re: RT coverage
Posted: Tue Sep 24, 2024 11:41 am
by Harrier77
Hi,
I just want to know if I can expect good coverage at an airport before I plan a flight. The current plots do not show when there is good coverage from a data provider who does not supply signal strength to RT; so the RT data sent to PSXT at an airport might be better than indicated on the plot.
Anyway, no worries. I will make do with what you currently provide.
Peter
Re: RT coverage
Posted: Tue Sep 24, 2024 12:04 pm
by admin
You should also look at the GND fraction number (anything below 60% isn't very good) and the mean ground signal (-49.5 indicates likely insufficient coverage for smooth traffic).
Re: RT coverage
Posted: Wed Sep 25, 2024 2:01 am
by Will
The Real Traffic User Positions plot is kinda fun! I'm the one in Japan right now.
Re: RT coverage
Posted: Wed Sep 25, 2024 3:01 am
by admin
In the early days of RT, there was an option to inject other simulator user's aircraft as well, so you would fly with real air traffic AND real other simulators... that wasn't very much liked though. That option is still there, but only for LAN users when running multiple RT with PSX instances in the same network. Embry Riddle are using that in their air operations lab to teach operations/dispatcher courses.
I've been thinking about implementing a way to store user's flights/flight paths so you can go to the website and retrieve your logs. That'll require an entire rat tail of modifications though, if done right all the way to changing the licensing to be user account based and not license code based, that's a major overhaul of the whole system. And with only 24h in the day, I don't see that happening anytime soon.
Re: RT coverage
Posted: Wed Sep 25, 2024 5:55 am
by Harrier77
admin wrote: Tue Sep 24, 2024 12:04 pm
You should also look at the GND fraction number (anything below 60% isn't very good) and the mean ground signal (-49.5 indicates likely insufficient coverage for smooth traffic).
Thank you for this information, I shall use this to understand the likely situation at an airport better.